

GHG inventory
A greenhouse gas inventory where every figure shows its source.
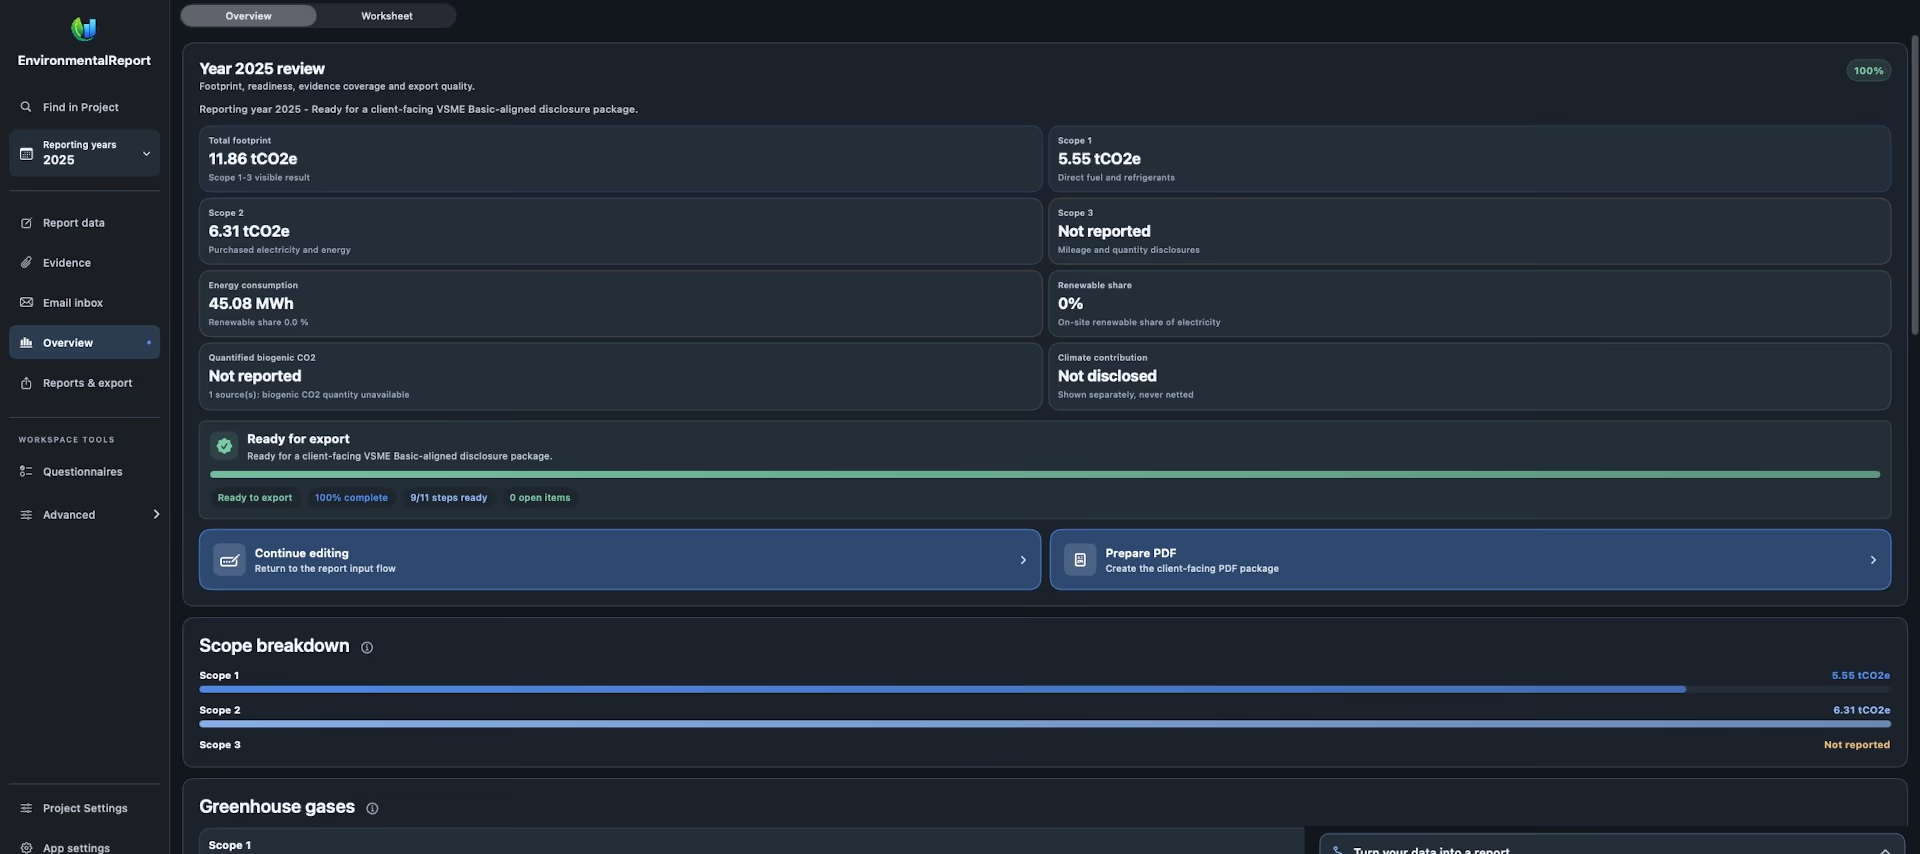
Scope 1, both Scope 2 methods and the 15 categories of Scope 3 are calculated from your activity data with documented emission factors, on the IPCC AR6 global warming potentials.
What the inventory covers
Scope 1
Fuels in stationary and mobile combustion, company vehicles and refrigerant leakage, with CO2, CH4 and N2O kept separate.
Scope 2, both methods
Market-based and location-based results from the same electricity data. They are alternative views and are never added together.
Scope 3, all 15 categories
For each relevant category you choose a documented method and factor; the app helps you avoid counting the same activity twice.
IPCC AR6
New reporting years use IPCC AR6 GWP100. You can compare it line by line with each source's original basis.
Documented emission factors
Default factors come from recognised public sources: the UK Government GHG Conversion Factors (DESNZ) for fuels and transport, the AIB European Residual Mixes for market-based electricity, and a national source or the AIB Production Mix for location-based electricity. A supplier-specific or contractual factor can replace a default when you document it.
Below every Scope 1 and Scope 2 figure the report prints the factor actually used, whether it is a default or your own factor, its source and year, and the calculation quantity × factor = result.
Energy from the same data
The energy figures for B3 are calculated automatically from the activity cards: consumption in MWh, the renewable share and the split by source. Only purchased electricity covered by guarantees of origin counts as renewable, and nothing is counted twice.
Biogenic CO2 shown separately
CO2 from biofuels and biomass is always quantified and shown on its own line. A guided assessment records whether the GHG Protocol Land Sector and Removals Standard applies to your company.
Inventory reports
- GHG inventory PDF with summary tiles, tables by source and Scope 3 category, gases and emissions over time against your base year
- Carbon footprint PDF, a shorter output from the same calculation
- GHG intensity per million of turnover
Frequently asked questions
Which scopes does the app calculate?
Scope 1, Scope 2 by both methods and the 15 categories of Scope 3. You add only the Scope 3 categories that are relevant to your company and for which you have data.
Where do the emission factors come from?
From DESNZ, the AIB European Residual Mixes and national sources such as OKTE for Slovakia. The Methodology Statement lists every source and rule.
How does this differ from the free carbon footprint report?
The free report gives a quick carbon footprint in your browser: Scope 1, Scope 2 and selected Scope 3 transport items. The app adds both Scope 2 methods, all 15 Scope 3 categories with governed factors, evidence for every figure, comparisons over the years and the VSME report.
Read next
- Methodology StatementHow every figure in an EnvironmentalReport report is calculated.Read more
- VSME reportBasic Module B1–B11, Comprehensive C1–C9 and a method beside every figure.Read more
- PACT product carbon footprintThe cradle-to-gate carbon footprint of your products under PACT, built up along the supply chain.Read more